Resources
Power is no longer a background variable in AI infrastructure. It is a first-order constraint that sets the ceiling on cluster scale and opex, as well as on how aggressively new capacity can be provisioned. Once training runs stretch into multi-week windows on thousands of accelerators, the limiting factor is not whether compute can be acquired, but whether it can be sustained inside a fixed power and thermal envelope while keeping utilization high.
This is not a theoretical concern. While training large models dominates the headlines, the economics are shifting: recent estimates suggest inference now accounts for 80–90% of a model's lifecycle energy consumption. This changes the engineering mandate. The industry is moving from optimizing bursty, high-intensity training runs to managing sustained, relentless power delivery for millions of daily interactions.
Source: Paper
Operationally, this efficiency is inseparable from reliability. At a large scale, failure becomes routine rather than exceptional. Meta’s public reporting on Llama 3 highlights hundreds of interruptions during a single run, forcing power-aware designs that carry a time and energy penalty with every recovery window. Furthermore, for operators in Europe, this is now a compliance issue; the EU's Energy Efficiency Directive (EED) has made sustainability a regulatory requirement.
A credible strategy starts with measurement. A baseline metrics that directly tie to useful work—joules per token or per training step—rather than abstract debates is needed. This article lays out a practical framework for optimizing that efficiency across the stack, from hardware selection and topology to facility constraints and carbon-aware scheduling.
Defining the KPI stack for energy-efficient AI
Energy optimization breaks down when teams cannot agree on what success means. A facility operator tracking Power Usage Effectiveness (PUE) sees a different number than the ML engineer watching GPU utilization, who sees a different number than the finance team modeling cost per query.
Without a shared metric stack that maps cleanly from cluster telemetry to business outcomes, efficiency initiatives fragment into local optimizations that often conflict at the system level.
The stack divides into three tiers: compute-side metrics that capture work performed per unit of energy, facility-side metrics that capture infrastructure overhead, and carbon-side metrics that capture the climate impact of the energy consumed.
1. Compute-side:
The fundamental unit of useful work in inference is the token; in training, it is the step. Energy efficiency at the compute tier, therefore, reduces to joules per inference token and joules per training step for training workloads.
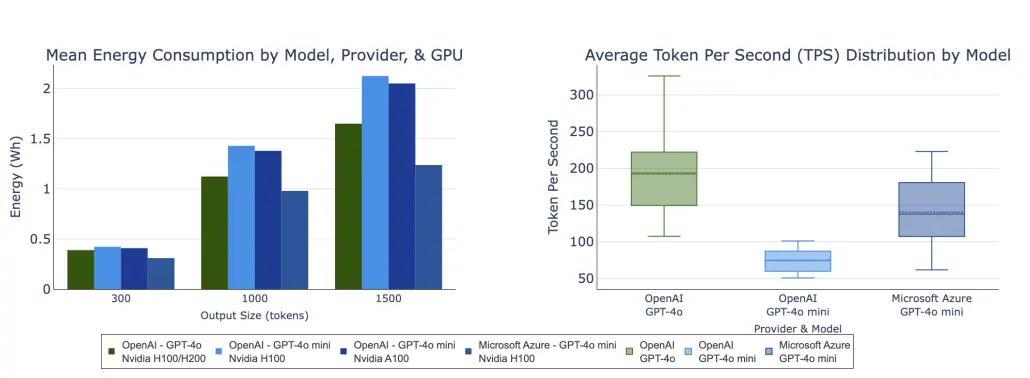
The range across hardware generations and optimization strategies is substantial. Measurements of LLaMA-65B inference on older V100 and A100 GPUs found energy consumption of approximately 3–4 joules per output token. However, recent tests with Llama-3.3-70B on H100 hardware (utilizing FP8 quantization and high concurrency, with a batch size of 128) showed a dramatic improvement to approximately 0.39 joules per token. This ~10× reduction underscores that efficiency is a function of the full software-hardware stack, not just the silicon.
Newer proposals suggest reporting energy per token as a standard efficiency metric alongside FLOPs or latency. However, normalization remains an open engineering problem because a "token" from GPT-4 is not equivalent to a "token" from Llama-8B in terms of information density or reasoning capability; raw comparisons can be misleading. Until standards mature, the pragmatic approach is to report energy per token alongside model parameters, quantization levels, and task-quality benchmarks.
2. Facility-side
Power Usage Effectiveness (PUE) remains the industry standard for facility efficiency, defined as total facility power divided by IT equipment power. A PUE of 1.0 means all power goes to compute; anything above represents overhead from cooling and power conversion.
While the industry average has plateaued around 1.56, hyperscale operators have pushed it close to the theoretical limit. Google reported a global fleet average of 1.09 in 2024, and Meta’s Luleå facility near the Arctic Circle achieves roughly 1.07.
However, PUE is becoming a deceptive metric. It captures facility overhead but ignores IT efficiency. A facility with excellent PUE but poor GPU utilization may consume more total energy than a facility with mediocre PUE but highly optimized workloads.
Furthermore, the rise of liquid-cooled, high-density clusters (pushing 100kW+ per rack) is shifting the primary constraint from efficiency to density. When facility power distribution cannot support the required density, the result is throttling or stranded capacity, regardless of the PUE score.
3. Carbon-side
Carbon reporting follows the GHG Protocol Scope 2 Guidance, which is bifurcated into two parts. Location-based reporting reflects the physical reality of the grid where the compute sits. Market-based reporting reflects contractual instruments like Renewable Energy Credits (RECs).
The divergence between these two can be massive. A data center in a coal-heavy region might report near-zero market-based emissions through aggressive REC purchases, even while its physical electricity consumption drives fossil fuel demand.
Consequently, the industry is moving toward 24/7 matching of Carbon-Free Energy (CFE). Unlike annual matching, where a company generates enough solar in the summer to "offset" coal usage in the winter, 24/7 CFE requires hourly matching of consumption with carbon-free generation.
The gap matters, as simulations show that a facility with "100% renewable matching" on an annual basis might be only 85% carbon-free on an hourly basis, leaving it exposed to high-carbon grid pricing and emissions during peak hours.
Operational reality: Selecting the metrics
For most deployments, the recommendation is a practical starting set that balances granularity with overhead:
- Energy per token (inference) / Energy per step (training): This is the primary efficiency signal. It is recoverable from standard GPU power telemetry (DCGM/nvidia-smi) combined with workload counters. The TokenPowerBench framework defines a measurement model for this, allowing users to benchmark from workstations to clusters.
- GPU utilization vs. throughput: Standard telemetry must be interpreted carefully. High utilization with low throughput suggests memory bandwidth or interconnect bottlenecks rather than efficient compute.
- Rack-level power density: This is the hard constraint for scaling. Monitoring power draw at the PDU level prevents throttling events and informs capacity planning.
- Location-based carbon intensity (gCO2eq/kWh): While market-based reporting is standard for compliance, engineering teams should optimize against location-based intensity to enable "follow-the-sun" scheduling.
5. Procurement and compliance standards
Based on regulatory direction (specifically the EU EED) and enterprise buyer behavior, the following metrics currently carry the most weight in commercial discussions:
PUE (Power Usage Effectiveness): Despite its limitations, this remains the primary filter. The EU Energy Efficiency Directive (EED) mandates reporting for facilities with an IT load> 500kW, and the EU Code of Conduct targets a PUE ≤ 1.1 for new builds by 2030.
Renewable energy percentage (Annual): Standard in enterprise sustainability reporting and usually a hard contractual requirement.
Dual-scope emissions reporting: Enterprise customers with Science-Based Targets (SBTi) increasingly require both location-based and market-based Scope 2 emissions data.
Emerging standards (AI energy score / CFE): The industry is seeing early movement toward the AI Energy Score (developed by Hugging Face) as a way to benchmark model-specific efficiency, and CFE Scores for customers with aggressive 2030 net-zero commitments.
6. Normalizing across model families
This remains an open engineering problem without a clean industry standard. The key challenges are:
- Token definitions: A GPT-4 token is not semantically equivalent to a Llama token.
- Quality/cost trade-off: A 7B model may be efficient per token, but requires 10× as many tokens to solve a reasoning task as a 70B model.
- Serving non-linearity: Batch size, sequence length, and quantization create non-linear energy profiles.
Until a standard like Stanford Hazy Research’s "Intelligence per Joule" matures, a transparency-first approach is the most practical path. Energy per token must be reported strictly alongside the context of model family, parameter count, quantization level, and serving config. This provides enough context for informed comparison without presenting a misleading "normalized" single number.
Why you should prioritize compute efficiency
The largest sustainable gains often come from not spending the watt in the first place. Model and system choices that improve utilization reduce both energy and capex pressure—especially for open-model organizations that train often and iterate quickly. Storage and data movement matter because wasted I/O results in wasted energy, even when GPU utilization appears healthy.
1. Where systematic energy waste occurs
Training runs exhibit predictable waste patterns. While "utilization" is the headline metric, the actual energy drains are often hidden in the gaps between computations.
- Idle gaps from load imbalance: When training is unequally divided, processors with lighter loads finish early but run at full power while waiting. Up to 30% of the power used to train AI is wasted this way, with "zero impact on training time and model accuracy."
- Stragglers: A five-month trace of LLM training clusters found that 42.5% of training jobs experience straggler effects. In large jobs with slowdown factors above 3×, fewer than 3% of workers were responsible for the problem, mostly due to hardware issues or misconfiguration. These stragglers force all other GPUs to wait at synchronization barriers, burning power while doing nothing.
- Data stalls: GPUs process data faster than storage can feed them. Studies have shown that unoptimized deployments experience 30–50% GPU idle time due to data starvation. The culprit is rarely the compute itself, but rather an infrastructure mismatch in which preprocessing consumes up to 65% of epoch time.
- Checkpoint bursts: Large models require frequent checkpointing for fault tolerance, creating synchronized I/O storms. A LLaMA 70B checkpoint (approx. 520GB) can take upwards of 20 minutes on standard networks. Thousands of GPUs simultaneously ramping power for checkpoints can cause massive facility-level fluctuations and even lead to blackouts.
- Recovery overhead and failover drag: Standard network fabrics struggle to reroute traffic during node failures, leading to "zombie" computations where healthy GPUs continue to consume peak power while waiting for a recovered node to rejoin. By the time a failure is detected and the fabric re-converges, the resulting idle synchronization can waste thousands of kilowatt-hours per incident, turning every hardware hiccup into a facility-wide energy drain.
2. Tuning levers that reduce energy without eroding quality
Mixed precision (BF16 vs. FP8): BF16 has become the standard for LLM training because it matches FP32's dynamic range while halving memory footprint. While FP8 offers theoretical throughput gains (from ~415 TFLOPS to ~570 TFLOPS on Llama-3-70B), it remains operationally risky. Analysis of MS-AMP showed "non-trivial performance degradations," and independent runs have documented unstable training loss.
Current recommendation: Use BF16 for training stability; reserve FP8 for inference or use strictly with the NVIDIA Transformer Engine’s outlier suppression.
Critical-path-aware scheduling: When pipeline stages have unequal compute, smaller stages can run slower without affecting the critical path. Tools like Perseus identify the forward/backward passes that determine iteration time and slow down non-critical operations to match, saving up to 30% of energy with no impact on throughput.
Asynchronous checkpointing: Splitting checkpointing into a snapshot (GPU-to-host memory) and a persist (host-to-storage) phase hides I/O latency. Using this technique, DataStates-LLM achieves 3× faster checkpointing than the state of the art, yielding a 1.3× end-to-end training speedup.
Data pipeline optimization: The "many small files" problem, which is common in NLP preprocessing, cripples I/O performance. Caching training data closer to compute eliminates I/O stalls across epochs, converting storage-bound training to compute-bound.
3. Energy optimal approach
The energy-optimal approach depends on where you are in the development cycle.
- Use scaling laws to reduce exploration: MIT-IBM Watson AI Lab research fit over 1,000 scaling laws across 485 pretrained models, and their key finding was that training a target model on just 30% of its dataset provides sufficient signal for extrapolating performance, saving 70% of exploratory compute.
- Data mixture laws: A recent work shows that optimal domain weights found from small-scale runs transfer to models 8× larger with no refitting, eliminating the need for trial-and-error mixture tuning at scale.
- Chinchilla vs. inference-aware optimality: Classic Chinchilla scaling optimizes for training compute. However, when inference costs dominate (high-usage production models), it is economically efficient to overtrain smaller models. A smaller model trained on more tokens achieves the same performance while consuming significantly less power during its inference lifecycle.
- Parameter-efficient fine-tuning (PEFT): Methods like LoRA freeze most pretrained weights, reducing fine-tuning compute by 50–70% while maintaining near full-tune accuracy.
Practical Guidance:
- For architecture search, train 5 proxy models at 1–10% of target size.
- For hyperparameter tuning, use Bayesian optimization rather than grid search.
- For production, invest in utilization tooling (DCGM/Zoomer) to catch stragglers before they burn GPU-hours.
Scheduler-level power optimization
Scheduling is one of the few places where energy budgets can be enforced without asking model teams to rewrite code. Power-aware schedulers trade time and throughput against a power envelope, and they can do it continuously with telemetry feedback.
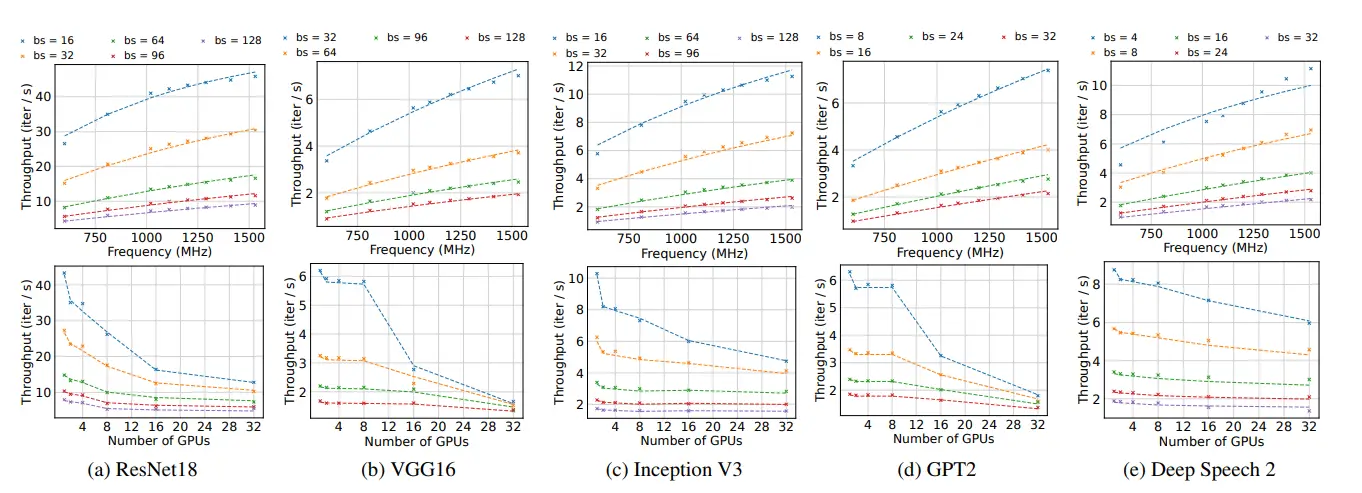
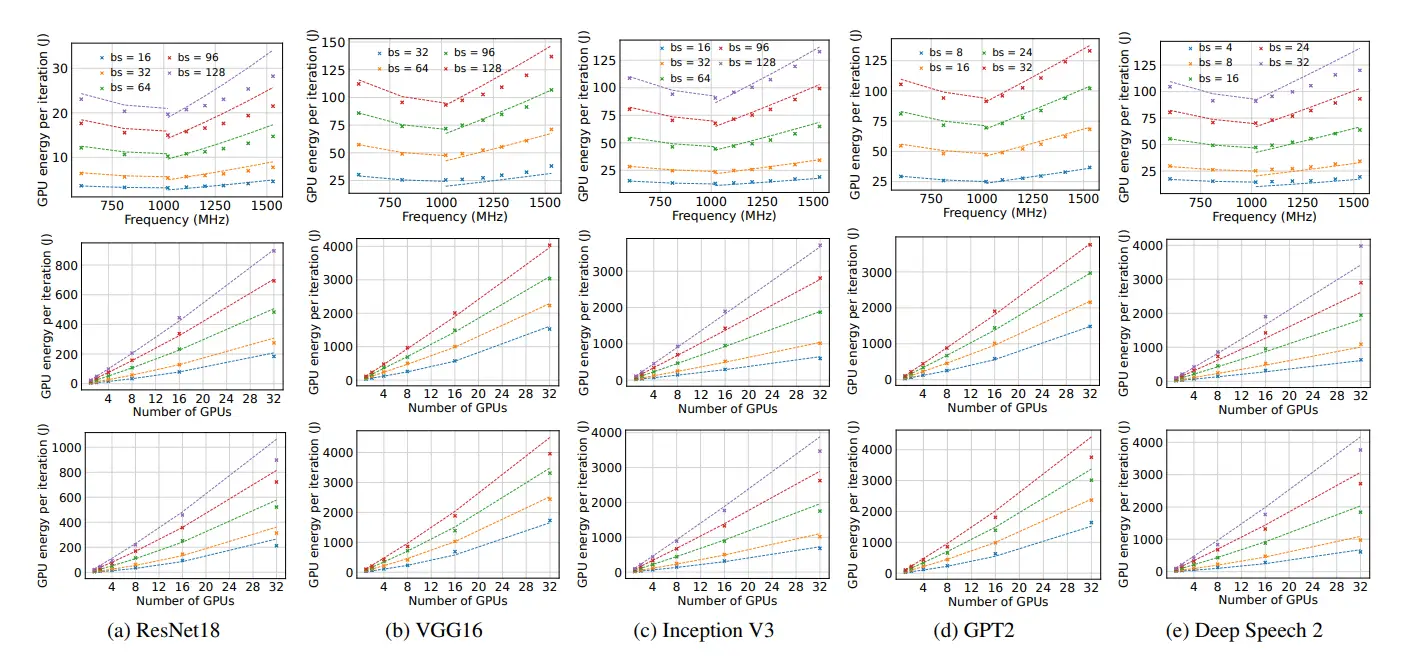
Energy-budgeted scheduling is no longer theoretical as PowerFlow, for example, dynamically allocates GPUs and adjusts clock frequencies under a fixed energy budget, improving average job completion time by 1.57–3.39× compared to baselines at equivalent energy consumption. Performance models for DL training jobs can predict throughput and energy across configurations, allowing the scheduler to make informed tradeoffs rather than running everything at max power.
Source: Paper
Co-location offers further gains with EaCO, the first energy-aware scheduling algorithm designed specifically for DL training workloads, which uses GPU sharing across multiple jobs to improve utilization without sacrificing performance. In large-scale cluster simulations using production traces, EaCO reduced total energy by up to 39% compared to existing algorithms, while increasing job runtime by less than 3.2%. For individual jobs, co-location improved energy efficiency by up to 44% and pushed average GPU utilization to 97%.
Source: Paper
The behavioral risk is that users may compensate for slower jobs by requesting more GPU hours, negating the savings. Although Helios addresses this by predicting future resource utilization from history logs to decide which GPU nodes to power down, saving up to 1.65 million kilowatt-hours per year across four production clusters without a user-visible performance impact.
Power capping and performance shaping
Power capping can reduce peak draw and thermal stress with limited performance loss, but it must be measured per workload. The practical value is often not the raw energy saved per job, but the infrastructure it unlocks—higher rack density without tripping power limits, higher sustained utilization without thermal events.
The first large-scale empirical study of GPU power capping at supercomputing scale found significant decreases in both temperature and power draw with minimal impact on job performance. At MIT's research supercomputing center, a 60% power cap reduced average GPU temperatures and power consumption across thousands of jobs in a way consistent with statistical significance—while job completion times remained largely unchanged. The study also noted that lower temperatures may improve hardware reliability and extend mean time between failures, reducing embodied carbon from hardware replacement.
Microsoft's analysis of power management opportunities for LLMs in the cloud found that GPU servers are typically overprovisioned for power. The rated power of a DGX-A100 is 6,500W, but across all tested workloads, peak power never exceeded 5,700W. This headroom creates opportunity: power capping enables denser deployments without infrastructure upgrades.
NVIDIA's new Blackwell power profiles deliver up to 15% energy savings with at most 3% performance impact, while increasing data center throughput by up to 13%. Unlike raw frequency scaling, power profiles are workload-aware; users can invoke them directly via SLURM (power-profile MAX-Q-Training) or through orchestration tools such as NVIDIA Mission Control. The Blackwell products respond to external events, such as a utility provider requesting reduced consumption.
The risk remains behavioral. If users perceive performance degradation, they may request additional GPU jobs to compensate, negating any energy savings or even worsening consumption. This argues for transparent communication: power caps should be presented as policy with predictable tradeoffs, not ad hoc tuning.
6. Sustainable energy sourcing and siting strategy
Energy sourcing is not a slogan. It is procurement, site selection, and grid reality. For European sovereign AI in particular, sustainability is often tied to policy alignment and auditable infrastructure commitments.
Annual matching is not hourly matching: A business that purchases 100% renewable energy in Ireland on an annual basis is only 85% carbon-free on an hourly basis, according to simulations. The gap exists because renewable generation doesn't align with consumption. When wind dies down at night, the grid is powered by fossil fuels regardless of how many certificates the buyer holds. This is why some hyperscalers have committed to 100% 24/7 carbon-free energy by 2030, matching consumption with local carbon-free generation on an hourly basis.
Google introduced the CFE Score to measure hourly matching percentage by region. As of 2024, the company's global fleet averaged 64% CFE, with some data centers exceeding 90%. Google's partnership with AES delivers at least 90% of its 24/7 energy needs from carbon-free sources through a customized mix of solar, wind, hydro, and battery storage.
European regulation now mandates transparency: The EU Energy Efficiency Directive requires data center operators with installed IT power demand ≥500kW to report energy performance to a European database. The Delegated Regulation (EU/2024/1364) sets out KPIs, including PUE, water-use effectiveness, renewable energy fraction, and waste heat reuse. Reporting began in September 2024; the Commission will assess data in 2025 and may propose minimum performance standards or labeling schemes.
The Climate Neutral Data Centre Pact, representing over 85% of European data center capacity, commits signatories to climate neutrality by 2030. Targets include matching 75% of electricity demand with renewable energy or hourly carbon-free energy. From 2025, members will use mandatory EU reporting rather than separate self-audits.
Siting matters. Grid carbon intensity varies by location and time of day. Google's region-level CFE data shows Finland exceeding 95% CFE due to Nordic wind PPAs, while Taiwan historically sat below 20% before dedicated solar procurement. For workloads that can tolerate latency, "follow-the-sun" scheduling to low-carbon regions during their clean-energy hours reduces emissions without changing infrastructure.
7. Carbon measurement and reporting
If emissions per run cannot be measured, teams will not be able to optimize for reduction. The immediate win is tooling that ties energy draw to location-based carbon intensity during training and inference, then produces comparable reports.
Measurement tools exist; the challenge is adoption and standardization. Carbontracker tracks and predicts the energy and carbon footprint of training DL models by monitoring GPU power draw, forecasting carbon intensity during the training window, and outputting CO2-equivalent emissions alongside standard metrics. It supports SLURM deployment for cluster-wide tracking and produces aggregated logs suitable for reporting. A comparative review of seven carbon estimation tools—including Carbontracker, CodeCarbon, Eco2AI, and Experiment-Impact-Tracker—found a 2-fold variation in estimates, underscoring the need for calibration against physical wattmeters and consistent methodology across organizations.
Training a Transformer with neural architecture search emitted over 626,000 pounds of CO2, equivalent to the lifetime emissions of five American cars. Critically, R&D costs dwarf final training costs: their own LISA model required 4,789 jobs across 123 hyperparameter searches, with cumulative training time of 239,942 hours versus 120 hours for the final model. Without systematic reporting, this experimental overhead remains invisible.
Green AI (Schwartz et al.) proposed efficiency as a first-class evaluation criterion alongside accuracy. The paper introduced the FPO (floating-point operations) metric and argued that leaderboards should report compute cost rather than just performance. This framing—Red AI (accuracy at any cost) versus Green AI (efficiency as a design constraint)—has become the definitional anchor for subsequent work. A 2025 systematic review found that Schwartz's formulation is widely cited but rarely operationalized with consistent boundaries: most implementations omit Scope 3 emissions, water footprint, and embodied carbon.
Multi-region workloads require time-aware accounting. Carbon intensity varies by location and hour. Carbontracker addresses this by forecasting carbon intensity during the predicted training duration using grid API data, then using the forecast to estimate emissions. For multi-region inference, operators must aggregate location-specific intensities weighted by request volume—a capability not yet standard in most monitoring stacks.
Reporting formats matter for governance. EU-aligned compliance requires KPIs specified in Delegated Regulation (EU/2024/1364), including PUE, water-use effectiveness, and the renewable energy fraction. The GHG Protocol provides the framework for Scope 1, 2, and 3 accounting that appears in investor disclosures and CDP submissions. For customer governance reviews, the minimum viable report includes: energy consumption per training run (kWh), grid carbon intensity at time of execution (gCO2eq/kWh), and resulting emissions (kgCO2eq)—ideally with uncertainty bounds.
8. Economic impact
Efficiency is not only carbon. It means fewer infrastructure upgrades, fewer power constraints, and fewer cooling surprises. The value chain is straightforward: lower energy per unit of work reduces opex, stabilizes capacity planning, and extends the range of a fixed power budget.
Power and cooling are high but not dominant costs: For AI deployments, hardware and infrastructure typically represent 40–60% of total project costs, with operational costs (data pipelines, training, maintenance) potentially exceeding initial build investments by 3–5× without proper planning. Within operational costs, power and cooling are substantial: cooling alone accounts for 40–54% of total data center power consumption, and a 60 kW AI-capable rack in a high-cost U.S. state can exceed $200,000 in annual electricity costs.
For GPU clusters specifically, 80% of the GPU cost of ownership comes from capital costs, with 20% from hosting (including colocation and power). A cluster of 20,480 H100 GPUs at 80% utilization and PUE 1.25 would draw approximately 28–29 MW and cost $20.7M annually in electricity at average U.S. rates. This implies that capital costs dominate, but energy efficiency still determines whether you can deploy at all within a fixed power envelope.
Utilization is the key: Many AI deployments operate at only 30–60% capacity due to workload scheduling inefficiencies and development cycles. When a $30,000 GPU sits idle 40% of the time, you're paying $12,000 annually for unused capacity. Scheduler-level optimizations, power capping, and data pipeline tuning all aim to address this utilization gap.
The efficiency-to-density translation is often more valuable than raw savings: A 15% reduction in power per GPU doesn't just save 15% on electricity—it may allow 15% more GPUs per rack without exceeding power or thermal limits. In power-constrained deployments, this unlocked capacity can dwarf the direct cost savings.
Which interventions yield the largest reduction in cost per token or per training run depends on baseline: organizations with low utilization benefit most from scheduler and pipeline optimization; those already at high utilization see bigger gains from power capping and siting. The general priority order for most deployments: (1) eliminate data stalls and I/O bottlenecks (often 30–50% idle time), (2) implement energy-aware scheduling (up to 39% energy reduction per EaCO), (3) apply power capping where thermal headroom exists (up to 15% energy savings per NVIDIA profiles), (4) optimize siting and procurement for low carbon intensity (can halve emissions in favorable regions).
9. Future outlook: Sustainable AI as the default architecture choice
Sustainable AI stops being a side initiative once the power envelope becomes the limiting factor for every new cluster. The organizations that win in the long term will treat energy and carbon intensity as design variables, just as they treat latency and throughput.
Data center electricity consumption is expected to more than double by 2030, with AI identified as the primary driver. McKinsey projects $7 trillion in data center investment through 2030, with power-delivery lead times exceeding 3 years in major markets. At this scale, efficiency is not a sustainability badge—it's an infrastructure prerequisite.
In addition, the regulatory floor keeps rising as the EU Energy Efficiency Directive now mandates annual reporting of energy performance for data centers ≥500kW, with assessment in 2025 and potential minimum performance standards to follow. The Climate Neutral Data Centre Pact commits signatories representing over 85% of European data center capacity to climate neutrality by 2030. For operators serving European customers or subject to CSRD disclosure requirements, sustainability metrics are no longer optional.
On the other hand, NVIDIA's Blackwell power profiles deliver workload-aware energy optimization at the hardware level. Energy-aware schedulers like EaCO and PowerFlow demonstrate that significant efficiency gains are achievable without code changes. Carbon tracking tools enable per-run emissions reporting suitable for governance workflows. The pieces exist; the challenge is integration.
Our goal is to make this operational:
- Reduce wasted work first: Idle gaps, stragglers, data stalls, and checkpoint bursts can consume 30–50% of cluster energy. Fixing these requires pipeline tuning, scheduling policy, and asynchronous I/O—not hardware upgrades.
- Align remaining work with cleaner power: Siting in low-carbon regions, procuring 24/7 carbon-free energy, and scheduling flexible workloads during clean-energy hours reduces emissions without reducing throughput.
- Measure what customers can audit: Energy per run, carbon intensity at execution time, and resulting emissions—reported in formats compatible with EU regulation, GHG Protocol, and investor disclosure frameworks.
The organizations that build this into their operating model now will have a structural advantage when power becomes the binding constraint. Those who treat sustainability as a compliance checkbox will find themselves capacity-limited while competitors scale.